- The new study is narrower than the headlines: among 461,682 older Americans, total ultra-processed food intake wasn't linked to colorectal cancer (hazard ratio 0.97). It didn't look at other cancers
- Inside the total, in exploratory analyses, signals pointed both ways: reconstituted meat and fish products were linked to higher risk; bread, breakfast cereals and frozen desserts and milk drinks to lower risk
- The tightest controlled trial shows overeating: 20 inpatients ate about 508 calories a day more on an ultra-processed diet and gained 0.9 kg in two weeks. A 2025 home-based trial found less weight loss on ultra-processed food
- The wider evidence is observational and mostly rated low or very low certainty, though links with cardiovascular deaths, type 2 diabetes, anxiety and common mental disorders were graded "convincing"
- Focus on processed meat and sweetened drinks. They carry the most consistent signals. Packaged bread and cereals, especially whole grain, don't show the same pattern
Ultra-processed food has become shorthand for everything wrong with the modern diet. Then, in October, a study of nearly half a million people was reported as challenging "ultra-processed food cancer fears". Both framings flatten a more interesting picture. Here's what the new study measured, what the trials and a major review show, and why the type of ultra-processed food seems to matter more than the label. It isn't medical advice (see the note before the FAQ).
What the 461,682-Person Study Found
Evidence: Large prospective cohort — observationalThe study behind the headlines was published in PLOS Medicine on 15 October 2026 by Leila Abar, Erikka Loftfield and colleagues, with funding from the US National Cancer Institute. It used the NIH-AARP Diet and Health Study: 461,682 adults (274,269 men and 187,413 women) aged 50 to 71 when they joined in 1995 and 1996, all free of cancer at the start. Over a median of 18.8 years, 10,075 developed colorectal cancer (Abar, PLOS Med 2026).
Diet was measured once, with a 124-item food questionnaire. Each item was sorted using the NOVA system, and intake was expressed as grams of ultra-processed food per 1,000 calories. The typical participant got 43% of their energy from ultra-processed food. The models adjusted for age, sex, race and ethnicity, education, smoking, physical activity, alcohol, family history of cancer, self-rated health and total energy.
The headline result: people in the top fifth of ultra-processed food intake had no meaningful difference in colorectal cancer risk from those in the bottom fifth (hazard ratio 0.97, 95% CI 0.91 to 1.03). There was no link for the proximal colon, distal colon or rectum separately, and results didn't differ by sex. Adjusting further for diet quality and nutrients, or for body weight, gave 0.94, still not statistically significant.
The more useful finding came from splitting ultra-processed food into its parts.
Colorectal cancer risk, by type of ultra-processed food
Abar et al., PLOS Medicine 2026. Adjusted hazard ratios for colorectal cancer, top vs bottom fifth of intake. *Not statistically significant. Square = estimate; line = 95% confidence interval. Observational data: associations, not proof of cause.
The team also split nutrients by where they came from. Meat from ultra-processed sources was linked to higher risk (hazard ratio 1.08 per daily serving), and so was meat from other sources (1.04). Whole grains, fibre, dairy and calcium from ultra-processed sources were all linked to lower risk. That matters because in this cohort, ultra-processed foods supplied 82.8% of whole grain intake and 74.3% of processed meat. Swapping 10% of ultra-processed food by weight for minimally processed food was linked to about 2% lower risk (0.98, 95% CI 0.96 to 0.99).
The authors concluded that total ultra-processed food "was not associated" with colorectal cancer in this cohort, and that the results support existing advice to eat whole grains, fibre, dairy and calcium and to avoid processed meat. They suggest the null overall result "may be explained, in part, by opposing associations of some UPF with CRC risk."
Three caveats. Participants were older and mostly white, diet was measured once in the mid-1990s, and the questionnaire was designed to measure nutrients, not processing. The authors note that someone who reported eating yoghurt could have eaten flavoured or plain, and they describe the food group analyses as exploratory.
What Counts as Ultra-Processed?
Evidence: A useful but contested definitionAlmost every study here uses NOVA, a system developed by Carlos Monteiro and colleagues. It sorts foods into four groups (Monteiro, Public Health Nutr 2019):
- Group 1, unprocessed or minimally processed: whole foods, including those only altered by processes such as drying, freezing or pasteurising.
- Group 2, processed culinary ingredients: cooking ingredients such as oils, sugar and salt.
- Group 3, processed foods: group 1 foods with group 2 ingredients added, such as canned vegetables or simple cheeses.
- Group 4, ultra-processed foods: "formulations of ingredients, mostly of exclusive industrial use", typically with additives.
NOVA's authors offer a practical test: check whether the ingredient list contains at least one item characteristic of group 4. That means substances rarely or never used in home kitchens, such as high-fructose corn syrup, hydrolysed proteins or hydrogenated oils, or cosmetic additives such as flavours, colours, emulsifiers, sweeteners and thickeners.
The critics' main point is that people apply NOVA inconsistently. In a 2022 study in the European Journal of Clinical Nutrition, researchers asked food and nutrition specialists to classify 120 supermarket products (159 evaluators) and 111 generic foods (177 evaluators). Agreement was low, with a Fleiss' kappa of 0.32 and 0.34, where 1 would be perfect agreement. The authors concluded that "current NOVA criteria do not allow for robust and functional food assignments" (Braesco, Eur J Clin Nutr 2022). Even the authors of the BMJ umbrella review, which used NOVA throughout, note concerns about its "possible imprecision and inconsistency among evaluators." Misclassification of this kind is one reason study results disagree.
The Trials That Tested Cause
Evidence: Randomised controlled trials — small and shortNearly all the evidence on ultra-processed food is observational. The best-known exception is a 2019 trial by Kevin Hall and colleagues at the US National Institutes of Health. Twenty weight-stable adults (10 men, 10 women; average age 31, average BMI 27) lived at the NIH Clinical Center for 28 days. In random order, they spent two weeks on an ultra-processed diet and two weeks on an unprocessed diet. The meals offered were matched for calories, energy density, protein, carbohydrate, fat, sugar, sodium and fibre, and participants could eat as much or as little as they liked (Hall, Cell Metab 2019).
On the ultra-processed diet, people ate 508 calories a day more (± 106), almost all of it extra carbohydrate and fat, not protein. They also ate faster. Weight followed intake:
Weight change after two weeks on each diet
Hall et al., Cell Metabolism 2019. Mean change, 20 adults, randomised crossover, inpatient. Weight: +0.9 ± 0.3 kg (ultra-processed) and −0.9 ± 0.3 kg (unprocessed).
That's the most tightly controlled evidence that something about ultra-processed diets drives overeating. But it was 20 people for two weeks per diet, in a hospital, with no washout between diets. The authors wrote that their study "was not designed to identify the cause of the observed differences in energy intake." Candidates include faster eating and the higher energy density of the foods people actually chose. It shows a short-term effect on calories and weight, not on disease.
A second randomised crossover trial, in Nature Medicine in 2025, moved the test out of hospital. Fifty-five adults in England with overweight or obesity ate two home-delivered 8-week diets, as much as they liked, both following UK healthy-eating guidance: one minimally processed, one ultra-processed, with a 4-week break between. Both led to weight loss, but more on the minimally processed diet: 2.06% versus 1.05% of body weight, a difference of about 1 percentage point (95% CI 0.14 to 1.87) (Dicken, Nat Med 2025). It was still small and short, and measured weight and risk markers, not disease.
The Umbrella Review: 45 Pooled Analyses
Evidence: Observational — mostly low certaintyIn 2024, The BMJ published what its authors called the first comprehensive synthesis of the meta-analyses. Lane and colleagues included 14 meta-analysis studies with 45 distinct pooled analyses, covering 9,888,373 participants. Higher ultra-processed food intake was directly associated with the outcome in 32 of the 45 pooled analyses (71%). Every study was observational; the authors found no pooled analyses of randomised trials (Lane, BMJ 2024).
The review graded each finding twice: by statistical credibility, from class I ("convincing") to class V, and by GRADE, a measure of how much confidence the evidence deserves. Four findings reached class I. But on GRADE, 22 were rated low, 19 very low, 4 moderate and none high.
The strongest links, and how sure we are
| Outcome | Higher vs lower intake | Credibility | GRADE certainty |
|---|---|---|---|
| Cardiovascular death | RR 1.50 1.37 to 1.63 | Class I, convincing | Very low |
| Type 2 diabetes | RR 1.12 per 10% more ultra-processed food | Class I, convincing | Moderate |
| Anxiety | OR 1.48 1.37 to 1.59 | Class I, convincing | Low |
| Common mental disorders | OR 1.53 1.43 to 1.63 | Class I, convincing | Low |
| Death from any cause | RR 1.21 1.15 to 1.27 | Class II, highly suggestive | Low |
| Obesity | OR 1.55 1.36 to 1.77 | Class II, highly suggestive | Low |
Lane et al., BMJ 2024;384:e077310. RR = risk ratio; OR = odds ratio. Type 2 diabetes is a dose-response estimate (95% CI 1.11 to 1.13); others compare higher with lower intake. Anxiety and common mental disorder results are for prevalent conditions, largely from cross-sectional studies. All from observational studies.
So the associations are consistent and broad. But "convincing" here means statistically robust, not proven to be causal. The cardiovascular death link was graded class I yet very low certainty. Diet was measured in different ways across studies, which the authors say "introduces an inevitable measurement bias." And people who eat a lot of ultra-processed food tend to differ in income, smoking, activity and much else.
Not All Ultra-Processed Food Is Equal
Evidence: Consistent across large cohorts — observationalTwo other big cohorts also split ultra-processed food into subgroups.
US health professionals. A 2024 BMJ study by Fang and colleagues followed 74,563 women in the Nurses' Health Study and 39,501 men in the Health Professionals Follow-up Study, with diet measured every four years, for a median of 34 years (women) and 31 years (men); 48,193 died. The top quarter of ultra-processed food intake had a 4% higher risk of death than the bottom quarter (hazard ratio 1.04, 95% CI 1.01 to 1.07): 1,536 versus 1,472 deaths per 100,000 person-years. There was no link with cancer or cardiovascular deaths. Meat, poultry and seafood-based ready-to-eat products, such as processed meat, had the strongest associations, with hazard ratios of 1.06 to 1.43 across causes of death. Among people with similar overall diet quality, total ultra-processed food intake showed no consistent link with death (Fang, BMJ 2024).
Europe. A 2023 study in The Lancet Regional Health – Europe followed 266,666 adults in seven countries in the EPIC cohort for a median of 11.2 years, looking at multimorbidity: developing at least two of cancer, cardiovascular disease and type 2 diabetes. Each standard deviation of extra ultra-processed food (about 260 g a day) was linked to 9% higher risk (1.09, 95% CI 1.05 to 1.12). The links were most notable for animal-based products and sweetened drinks; ultra-processed breads and cereals, and plant-based alternatives, showed no link (Cordova, Lancet Reg Health Eur 2023).
Same label, different signals
| Type of food | NIH-AARP 2026 colorectal cancer | EPIC 2023 multimorbidity | US nurses & health pros 2024 death |
|---|---|---|---|
| All ultra-processed food | 0.97 no link | 1.09 | 1.04 |
| Processed meat products | 1.10 reconstituted meat & fish | 1.09 animal-based products | 1.13 ready-to-eat meat products; 1.06–1.43 by cause |
| Sugary and diet drinks | — not in main results | 1.09 | 1.09 |
| Bread and cereals | 0.91 bread, 0.84 cereals lower risk | 0.97 no link | 1.04 non-whole-grain breads & breakfast foods |
| Dairy desserts | 0.82 frozen desserts, milk drinks; lower risk | — not in abstract | 1.07 dairy-based desserts |
Hazard ratios. NIH-AARP (Abar, PLOS Med 2026): top vs bottom fifth. EPIC (Cordova, Lancet Reg Health Eur 2023): per 1 standard deviation of intake. US cohorts (Fang, BMJ 2024): top vs bottom quarter; US cohorts column is all-cause mortality. Different outcomes and units, so compare direction, not size. All observational.
The pattern: processed meat products were linked to higher risk in every analysis, and sweetened drinks (sugary and artificially sweetened, analysed together) wherever they were reported. Breads, cereals and dairy-based foods are mixed, ranging from lower risk to slightly higher, depending on the study and outcome. In the new NIH-AARP data, poor diet quality was linked to higher risk at both lower and higher levels of ultra-processed intake (for example 1.28 in the second fifth and 1.22 in the top fifth, compared with low intake and good diet quality), which again suggests the overall diet matters more than any single label. For more on diet drinks, see our artificial sweeteners evidence check.
Where to Focus First
You don't need to fear every packet. Focus on a few changes:
- Cut processed meat first. Bacon, ham, sausages, salami and other processed or reconstituted meat products carry the most consistent signal. Swap in beans, lentils, eggs, fresh chicken or fish. In the NIH-AARP data, meat from sources not classed as ultra-processed was also linked to slightly higher colorectal cancer risk (1.04 per daily serving), so swapping sausages for other meat isn't the whole answer.
- Rethink sweetened drinks. Sugar-sweetened and artificially sweetened drinks, analysed together, were linked to higher risk in both cohorts that reported them; in the US cohorts the link was generally stronger for sugary drinks. Water, sparkling water, tea and filtered coffee are easy defaults.
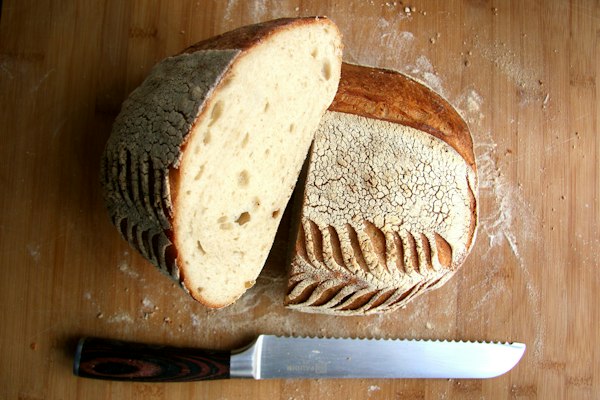
- Choose the better packaged staples. Ultra-processed bread and cereals weren't linked to higher colorectal cancer or multimorbidity risk in two large cohorts, and in NIH-AARP their whole grain and fibre were linked to lower colorectal cancer risk. Non-whole-grain breads and breakfast foods had a small link with higher mortality in the US cohorts (1.04). So pick ones with whole grain first in the ingredients and little added sugar. A real sourdough is often a short ingredient list.
- Prefer plain dairy. Dairy and calcium were linked to lower colorectal cancer risk, but dairy-based desserts were linked to higher mortality in the US cohorts. Plain yoghurt with fruit beats a dessert pot.
- Use the ingredient list. NOVA's test above is a fair rule of thumb. Then ask what else the product brings, such as fibre and protein, or sugar, salt and processed meat.
- Build the base from whole foods. Vegetables, fruit, legumes, nuts, whole grains and olive oil. Our anti-inflammatory grocery list is a practical start.
If you have diabetes, heart or kidney disease, a history of bowel polyps or a strong family history of colorectal cancer, or you're losing weight without trying, talk to your doctor or a registered dietitian.
Frequently Asked Questions
Mind the meat and drinks, not every packet.
Ultra-processed diets made people overeat in the one inpatient trial and slowed weight loss in a 2025 trial. High intake is also consistently linked to worse health in observational studies, though at low certainty. But the category is too broad to be a useful rule on its own: the new 461,682-person study found no overall link with colorectal cancer, and whole grain bread and cereals don't behave like processed meat.
Cut back on processed meat and sweetened drinks, choose packaged foods with short ingredient lists and real fibre, and build most meals from whole foods. If you have a health condition, talk to your doctor or a dietitian about what's right for you.
Sources
- Abar L, O'Connell CP, Hong HG, et al. Associations of food processing and dietary risk factors with colorectal cancer incidence in the NIH-AARP Diet and Health Study: a cohort study. PLOS Medicine 2026;23(10):e1005251 (doi:10.1371/journal.pmed.1005251). Published 15 October 2026. As reported by ScienceDaily.
- Monteiro CA, Cannon G, Levy RB, et al. Ultra-processed foods: what they are and how to identify them. Public Health Nutrition 2019;22(5):936–941 (doi:10.1017/S1368980018003762).
- Braesco V, Souchon I, Sauvant P, et al. Ultra-processed foods: how functional is the NOVA system? European Journal of Clinical Nutrition 2022;76(9):1245–1253 (doi:10.1038/s41430-022-01099-1).
- Hall KD, Ayuketah A, Brychta R, et al. Ultra-processed diets cause excess calorie intake and weight gain: an inpatient randomized controlled trial of ad libitum food intake. Cell Metabolism 2019;30(1):67–77.e3 (doi:10.1016/j.cmet.2019.05.008). See also the correction, which did not affect the primary outcome.
- Dicken SJ, Jassil FC, Brown A, et al. Ultraprocessed or minimally processed diets following healthy dietary guidelines on weight and cardiometabolic health: a randomized, crossover trial. Nature Medicine 2025;31(10):3297–3308 (doi:10.1038/s41591-025-03842-0). Published online 4 August 2025; open-access PDF (UCL Discovery).
- Lane MM, Gamage E, Du S, et al. Ultra-processed food exposure and adverse health outcomes: umbrella review of epidemiological meta-analyses. BMJ 2024;384:e077310 (doi:10.1136/bmj-2023-077310).
- Fang Z, Rossato SL, Hang D, et al. Association of ultra-processed food consumption with all cause and cause specific mortality: population based cohort study. BMJ 2024;385:e078476 (doi:10.1136/bmj-2023-078476).
- Cordova R, Viallon V, Fontvieille E, et al. Consumption of ultra-processed foods and risk of multimorbidity of cancer and cardiometabolic diseases. The Lancet Regional Health – Europe 2023;35:100771 (doi:10.1016/j.lanepe.2023.100771).